A Different Kind of Family Tree
By tracing the history of math education, Professor Farshid Safi’s genealogy project could impact future policy and practice.

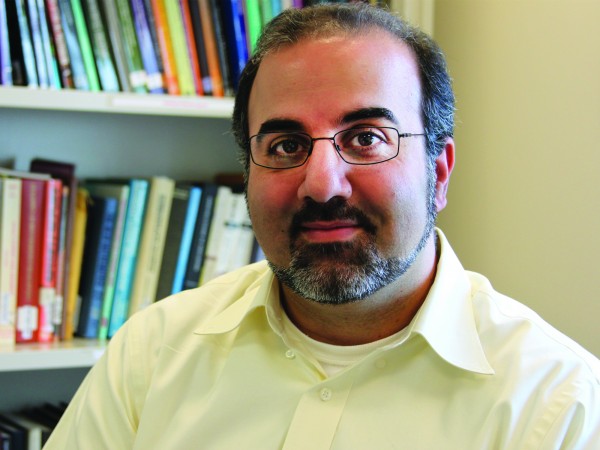
Professor Farshid Safi’s genealogy project provides insights into the influential people, institutions, organizations, and areas of research that shape how math is taught and learned.

Assistant Math and Statistics Professor Farshid Safi is working on a multiyear genealogy project that traces the evolution and development of the field of mathematics education in the United States.
By compiling qualitative data from numerous mathematics-education-related doctoral dissertations published in the U.S., and creating a system that lets people visualize and analyze that data, Safi’s project will provide insights into the influential people, institutions, organizations, and areas of research that shape how math is taught and learned.
The work involves collecting and categorizing a massive amount of data on the authors, advisers, institutional affiliations, and research focus areas of the more than 11,000 mathematics-education-related dissertations published during the last two centuries. Complicating that process is the fact that much of the material is only available in hard-copy format, meaning Safi and his student collaborator, Sahnaz Saleem ’14, must digitally extract the data they are after before they can work with it.
The two are about 70 percent of the way through that process, they reported, and now have a data set large enough to provide some meaningful insights. Using data mining techniques and third-party visualization software, Saleem said
the two can see patterns emerge that reveal how certain individuals and institutions have impacted the production of new knowledge in the field of mathematics education.
A math and statistics major, Saleem said what’s most valuable about the experience for her is having the chance to apply classroom learning in a real-world context. “In class we work with perfect data sets, so it’s easy to do an analysis. But when you have a real-life data set like with this genealogy project, the work is much more difficult because the data isn’t perfect,” Saleem said.
Assistant Professor of Interactive Multimedia John Kuiphoff is also working with Safi to build a project website and expand the data-visualization capabilities. That latter part is particularly important, Safi said, because it provides the “mosaic” people need to clearly see which individuals, institutions, and research topics have had the greatest impact on how math has been, and continues to be, learned and taught. “Until now, primarily linear, narrative histories of the field have been available,” he said.
As the data set becomes more complete, that mosaic might reveal more than how the field has developed and evolved; it could also impact how math teaching and learning can move forward, Safi said.
“In education, there seems to be a pendulum effect where, every 15 years or so, people say, ‘We have to overhaul everything.’ Then years go by and people say, ‘We have to go back to where we were,’” Safi said. “If we had a better sense of how we arrived to that point, that could better serve us moving forward. Subsequently, this perspective and knowledge could influence what happens on the K–16 level, which would impact decisions and potential policies for years to come.”
Posted on September 10, 2013

